
How to Diagnose Bearing Failure Modes: A Heavy-Industry Maintenance Guide
Roughly six in ten bearing failures are not a quality problem at all – they are a lubrication mismatch. That figure comes from more than 500 failure reports our technical desk has reviewed, and it exposes a gap that most maintenance routines never test. Procurement discussions tend to revolve around brand names and unit price, while the real cause of a stopped line is often a grease choice made without regard to load, speed, or operating temperature.
Reading a failure correctly and acting on it early can cut unplanned downtime by as much as 40% at an industrial plant. Over the past decade our engineers have supported maintenance managers in steel, mining, and power generation, and the pattern is consistent: disciplined failure analysis paired with traceable component sourcing removes repeat failures far more reliably than simply buying a different brand.
We have watched misdiagnosed failures escalate into operational chaos more than once. A steel mill lost $120,000 to a single eight-hour stoppage, and a mining operation kept buying counterfeit bearings that matched OEM drawings on paper yet collapsed under load.
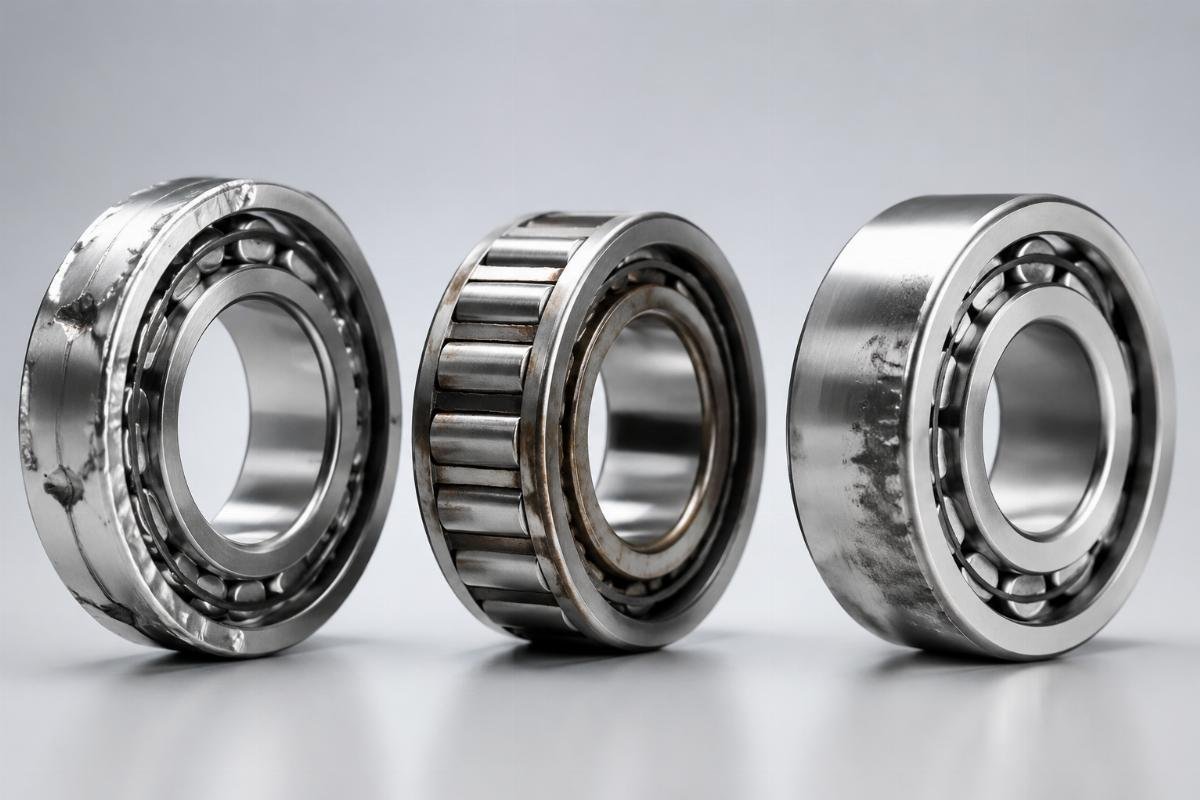
To see what failures actually cost, you have to count the visible items – replacement parts, labor – alongside the ones nobody invoices: lost output, delayed orders, and damage to the equipment around the bearing. The rest of this guide shows how diagnosis changes those numbers.
What Do Bearing Failure Modes Really Cost an Industrial Plant?
Where the money actually goes.
When the diagnosis is wrong, a plant can burn $240,000 or more a year on downtime and replacement parts. Production loss is only the first layer; every event ripples through maintenance schedules, spare-part inventory, and the operating plan, and those effects compound month after month.
| Failure Impact | Industry Average Cost |
|---|---|
| Unplanned downtime | $15,000 per hour in steel mills |
| Replacement parts | 30% premium for emergency sourcing |
| Labor costs | 4x regular rate for overtime repairs |
| Secondary equipment damage | 22% of failures cause collateral component wear |
| Production delays | Average 3-day recovery period for critical systems |
The five failure modes below each leave a recognizable signature. Fatigue shows as spalling on the raceways; contamination shows up as discoloration or particle indentations; misalignment produces uneven wear; lubrication starvation leaves burn marks; and overloading causes plastic deformation. The inspection process behind our ISO 9001 certification has logged that seven in ten of these events were preventable through correct diagnosis and correctly specified replacement parts.
A steel mill in Southeast Asia had been replacing 22324 CC/W33 spherical roller bearings in its continuous casting line almost every month. The maintenance team blamed the components and kept buying "original brand" sets at a 30% premium. Analysis pointed elsewhere: coolant was leaking into the lubrication circuit, and the grease was emulsifying and micro-pitting the rollers. We rebuilt the lubrication schedule around filtered, monitored grease and set up a 48-hour emergency shipment path. Downtime fell 65% and annual bearing spend dropped 25%.
Under a microscope the story is hard to misread: water droplets suspended in the grease, dark oxide staining across the roller surfaces, and a wear pattern that follows the load zone rather than the whole raceway.
- Fatigue Failure – Flake-like material lifting off the raceways or rolling elements is the signature; load cycles beyond the design envelope are the usual cause.
- Contamination Damage – Abrasive particles, corrosion, or discoloration in the lubricant point to a failed seal or a routine that is not keeping debris out.
- Misalignment Wear – Uneven load patterns and shoulder wear usually trace back to poor mounting practice or shaft deflection under load.
- Lubrication Starvation – Darkened raceways, overheating, and metallic debris in the oil sample mean the film is too thin, too old, or simply absent.
- Overloading Failure – Plastic deformation, cage damage, and roller skewing appear when real loads exceed the dynamic rating or a shock event hits the drive.
Why Do Standard Diagnostic Methods Miss the Real Fault?
Limits that surface when a single method carries the whole diagnosis.
Visual inspection on its own produces misdiagnosis rates around 40% in industrial bearing analysis. Failure modes resemble one another far more closely than most teams expect, and the problem gets worse once counterfeit components enter the supply chain looking correct on the outside while the steel underneath is wrong.
| Diagnostic Method | Common Misapplication | Optimal Implementation |
|---|---|---|
| Visual Inspection | Used as primary diagnostic tool | Combined with oil analysis and vibration data |
| Vibration Analysis | Interpreting data without load context | Correlating frequency patterns with operational parameters |
| Temperature Monitoring | Reacting to spikes instead of trends | Establishing baseline readings for early anomaly detection |
| Oil Sampling | Inconsistent collection procedures | Regular, scheduled analysis with particle counting |
| Load Testing | Static testing only | Dynamic testing under actual operating conditions |
Counterfeit product is the hardest case. Our engineers recently set a shipment of counterfeit SKF bearings beside traceable replacements and found external dimensions matched to within 0.02mm – yet hardness came in 15% low and the cage let go at 60% of rated load. None of that shows up in a visual check, and all of it shows up under production load.
One recurring error is confusing lubrication starvation with overloading, because both run hot. They need opposite fixes. Our post-sale failure analysis produces a written report with lubrication recommendations and mounting guidance for the specific application. A mining customer with repeated tapered roller bearing failures in cone crushers turned out to be running 32230 bearings on a viscosity grade too light for its operating temperature, even though the load calculations were correct.
The comparison is usually settled with a hardness test and a look at the microstructure: the counterfeit ring shows coarse carbides and an inconsistent case depth beside a properly heat-treated reference.
- Visual Inspection – Photograph everything at high resolution and check it against the manufacturer's dimensional data; never settle for a subjective call.
- Vibration Analysis – Read the spectrum for the frequency patterns tied to each failure mode instead of watching overall amplitude.
- Oil Analysis – Run particle counts and ferrography so early wear is caught before there is anything to see.
- Load Verification – Put real operating loads next to the bearing rating with a supplier calculation rather than assuming the original design was right.
- Installation Review – Check mounting practice, shaft tolerances, and alignment with measuring tools, not by feel.
What Does a Five-Step Diagnosis Look Like When a Supplier Is Involved?
Running a structured diagnosis with supplier engineering support cuts misdiagnosis by 60% and turns findings into a prevention plan. Reactive maintenance and predictive reliability differ in one habit: symptoms get connected to root causes systematically, with a supplier who knows both the component and the application in the room.
| Diagnostic Approach | Primary Advantage | Ideal Application Scenario |
|---|---|---|
| Vibration-Based Monitoring | Early detection of developing failures | High-speed rotating equipment like turbines |
| Oil Analysis Program | Identifies contamination and wear particles | Gearboxes and lubricated systems |
| Thermographic Inspection | Visualizes temperature anomalies | Bearings in hard-to-reach locations |
| Acoustic Emission Testing | Detects microscopic material failures | Critical safety-related components |
| Supplier Failure Analysis | Combines application expertise with component knowledge | Repeat failure situations without obvious cause |
The workflow starts before anything is pulled apart: temperature logs, oil samples, vibration spectra, and operating parameters are collected so the conditions that caused the failure are captured, not just the wreckage. Next comes failure-mode identification through microscopy and material testing, followed by root-cause analysis that ties those findings back to the application. Written documentation then builds a reference for the next event, and the prevention plan covers both the immediate replacement and the longer reliability fix.
A construction equipment depot needed an obsolete yaw bearing for a ten-year-old excavator. The 45x68x22mm needle roller unit had no OEM replacement available. Our cross-reference work identified a modern equivalent with adjusted clearance within hours, and the part shipped within 72 hours with SUJ2 chrome steel certification and anti-counterfeit verification attached. The repair stayed on schedule and the customer rated the support at 98%.
Laid out on one page, the five steps read as a loop rather than a line: data collection feeds mode identification, root-cause work feeds documentation, and documentation feeds the prevention plan that closes the loop at the next inspection.
- Data Collection Protocol – Log vibration at ten-minute intervals across the run-up to the failure, alongside temperatures, oil samples, and load records, so the diagnosis starts from operating evidence rather than from a stripped housing.
Need a quote for a specific bearing designation? Our engineers reply within one business day.
Request a quote